The Incident That Taught Me Data Pipeline Segregation
It was a usual Sunday afternoon, things were chill and suddenly I hear the familiar Slack notification. A new live-support incident.

I saw the message and immediately knew it was trouble. We were hosting a 5000 participant webinar, which I could already assume went far from ideal.
The Alerts Storm
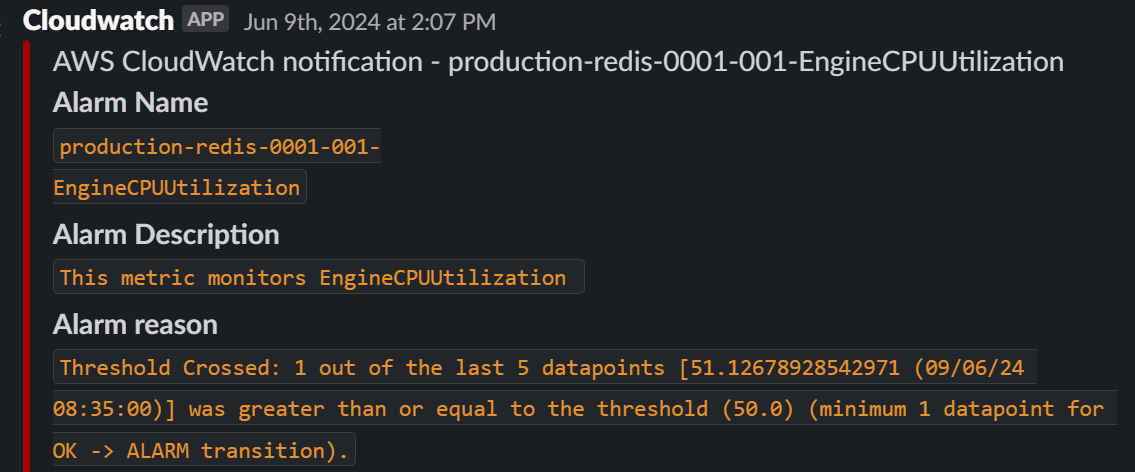
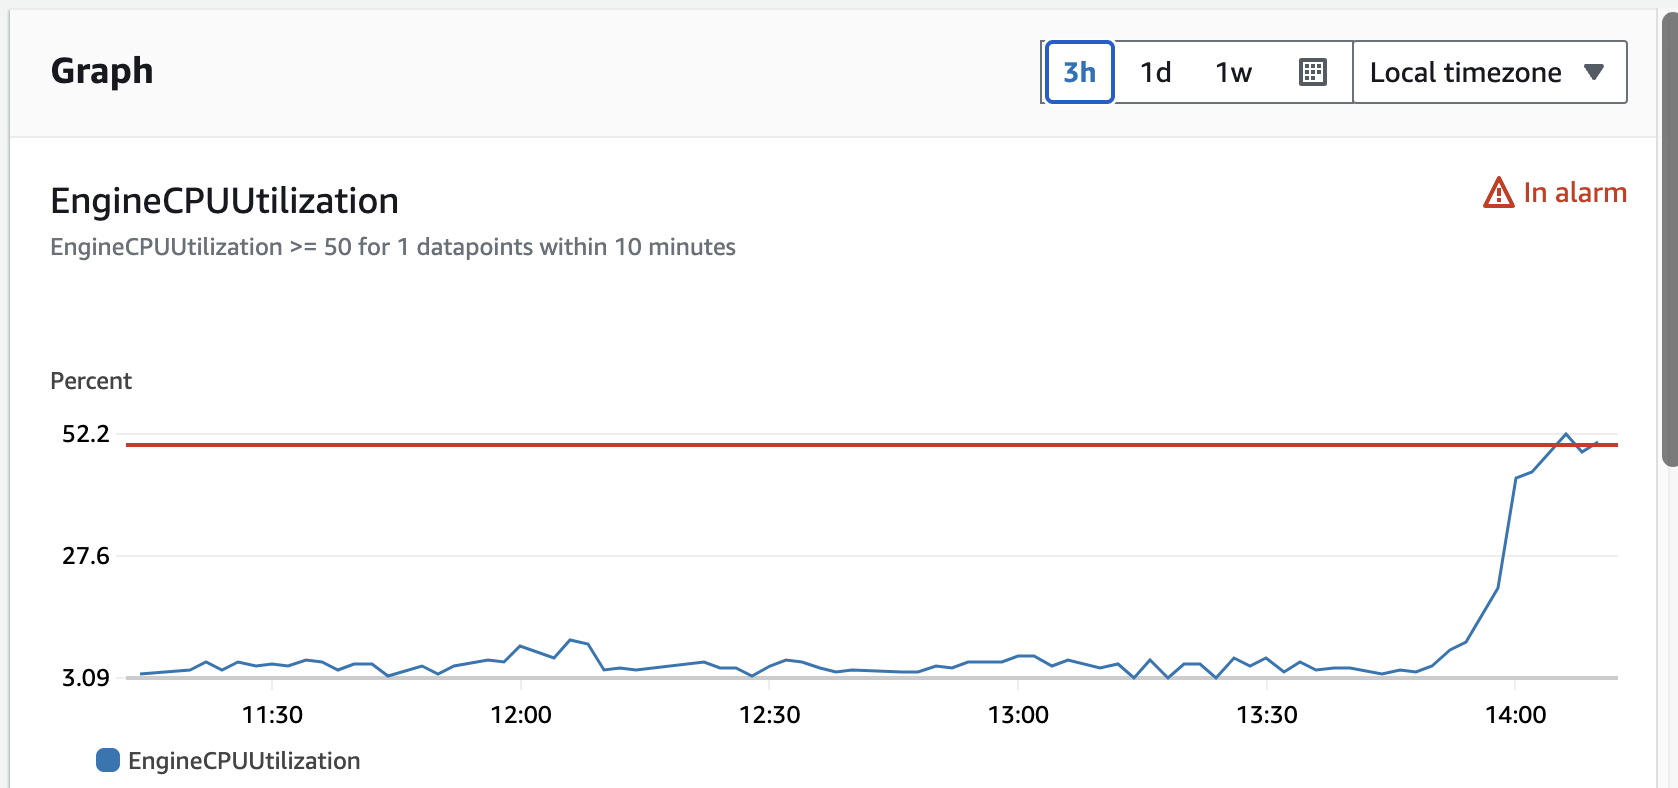
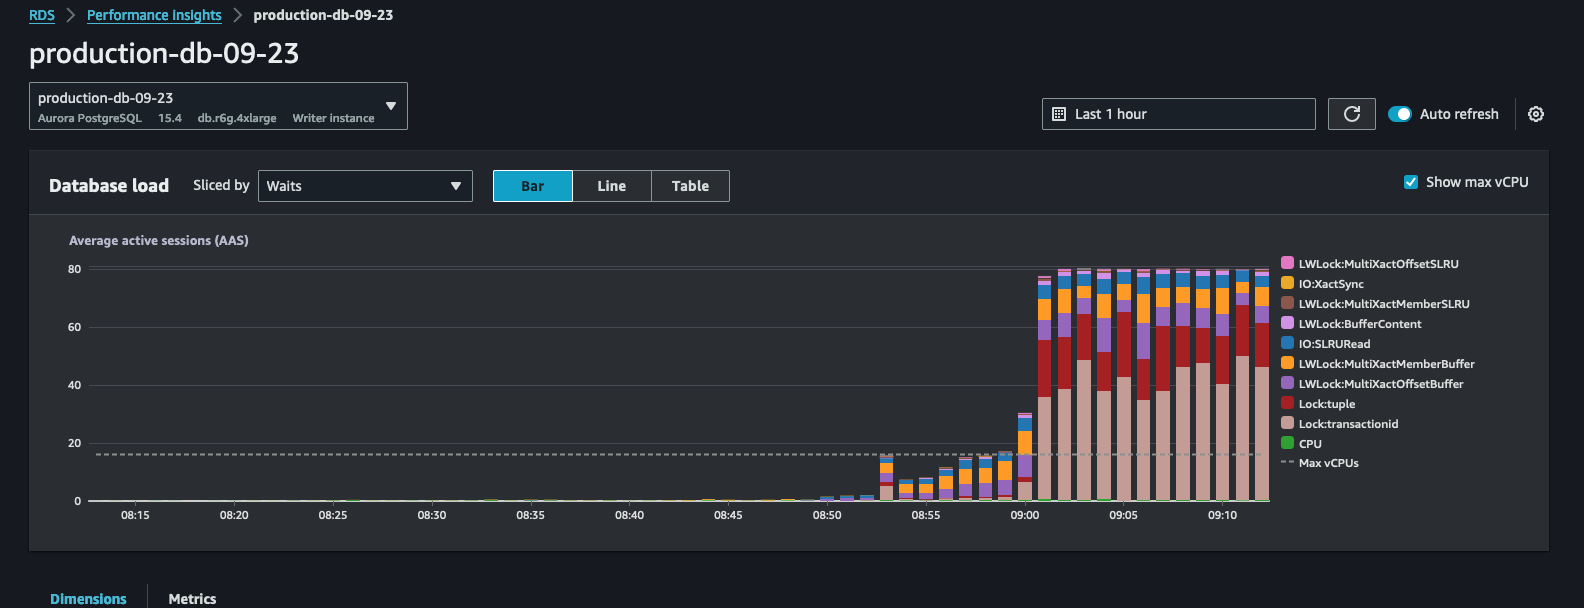
Our Redis metrics were showing unusual patterns - cpu usage and latency were spiking exponentially, a clear sign that something was wrong with our system.
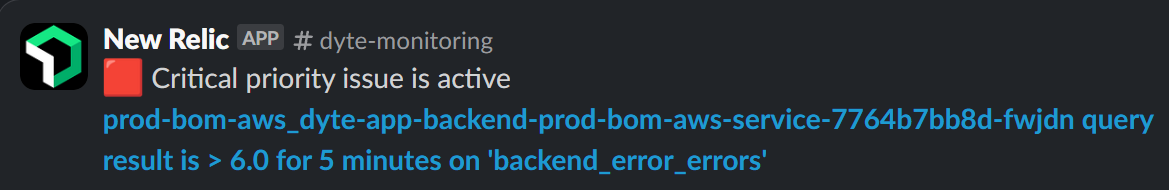
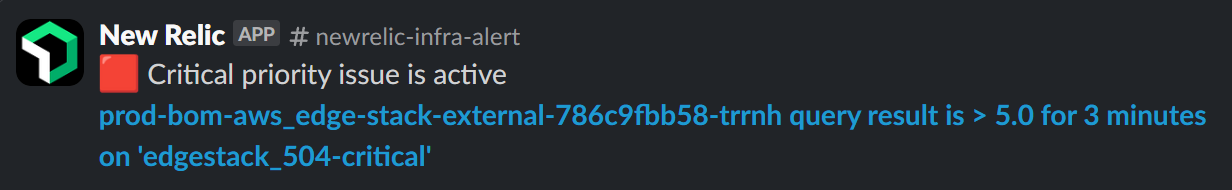
Backend latency was climbing exponentially while gateway timeouts started flooding our error logs - parts of our system were crashing down.
The Investigation Begins
We are a WebRTC / video conferencing platform, the session microservice is the source of truth for realtime meetings / sessions and their analytics data.
Sessions is a critical micro-service, relied upon by recording microservice, AI-related workers like live-transcription, and more. A failure here means critical business impact, and being the maintainer of the sessions microservice, I felt the gravity of it and quickly got to action. A teammate joined me on this effort.
I looked around Slack and found recent threads started by the SRE team regarding heavy lock usage on AWS RDS. The on-call engineer was getting paged about the service degradation.
So, the initial presumption was PostgreSQL got choked and all queries were hung. I started to simulate using a local script calling preprod nodes on Kubernetes - everything went fine. Bombarded the pods with millions of queries, slow but all went fine.
The Breakthrough
We tried one more time, stress testing our preprod nodes, plus invoking a few queries by-hand to the same nodes connected to the same DB. Bang, the queries got stuck now.
We started eliminating possibilities systematically, testing each possibility in isolation:
We were like, wtf was wrong then?
The Root Cause: ORM Pool Saturation
A realization dawned upon us: the DB was not the problem, it was the data pipeline, especifically the ORM pool had saturated. The important createSession() & getActiveSession() queries were waiting behind numerous DB update queries.
To understand why it's an issue, we need to understand that session broadly processes 3 types of events:
Primary events are written to the RDS writer instance, and Critical events also need to be served from the writer to avoid potential replication lag under load. This means both the Primary and Critical events were competing for the same limited connection pool to RDS writer.
But the primary events being high volume, they were saturating the pool, causing critical events to wait for connections.
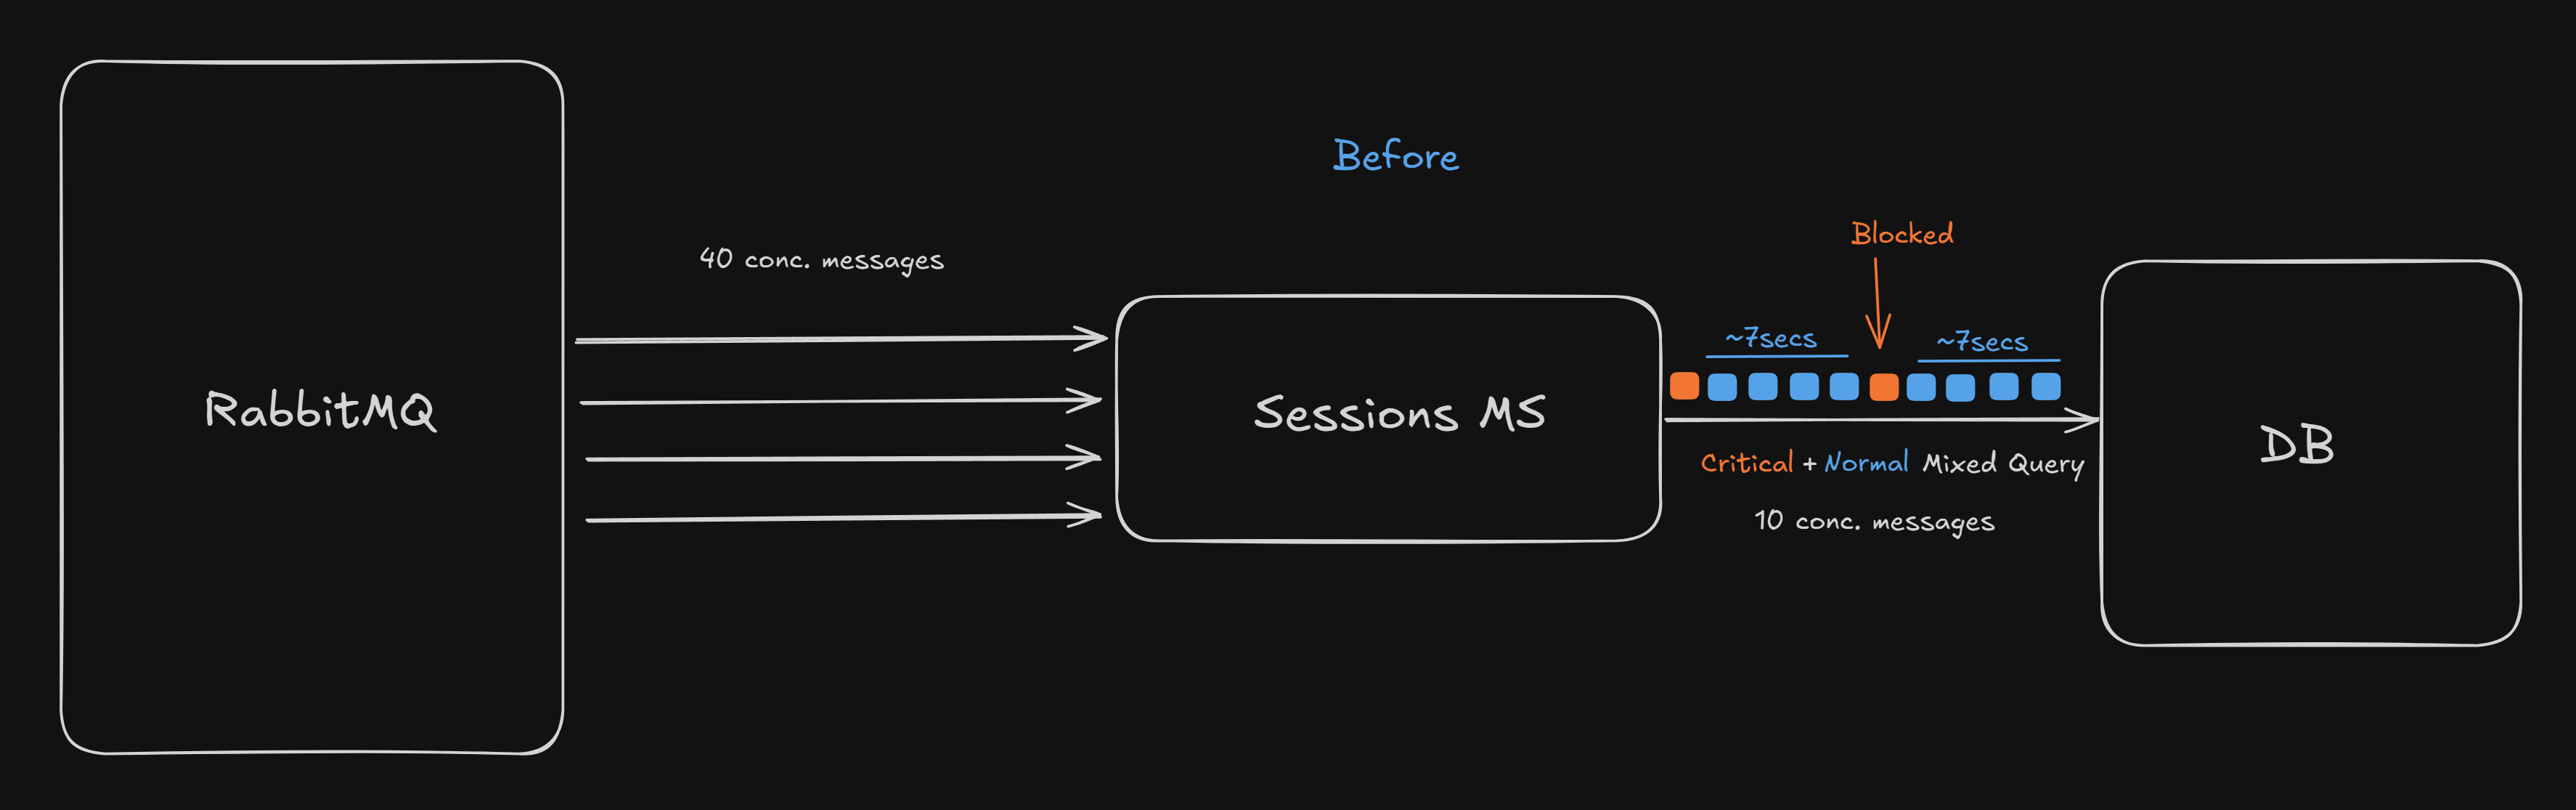
At peak times, the pool was always saturated by ~40 concurrent events from RabbitMQ, each of its handler parallely querying the DB with up to 2-3 queries, making the number of waiting queries per pool connection to (40 ÷ 10) × 3 = 12
Therefore every Critical event had to wait for 7 seconds before it could lay its hands on the DB. This caused all session creation and critical operations to fail. 😢
Old Architecture: Single Connection Pool
The Solution: Segregated Connection Pools
We realized that our important queries needed a different ORM pool which could give them congestion-free access to the database and be prioritized, especially so when the DB itself is under load and query latency is higher.
Solution: Segregated Connection Pools
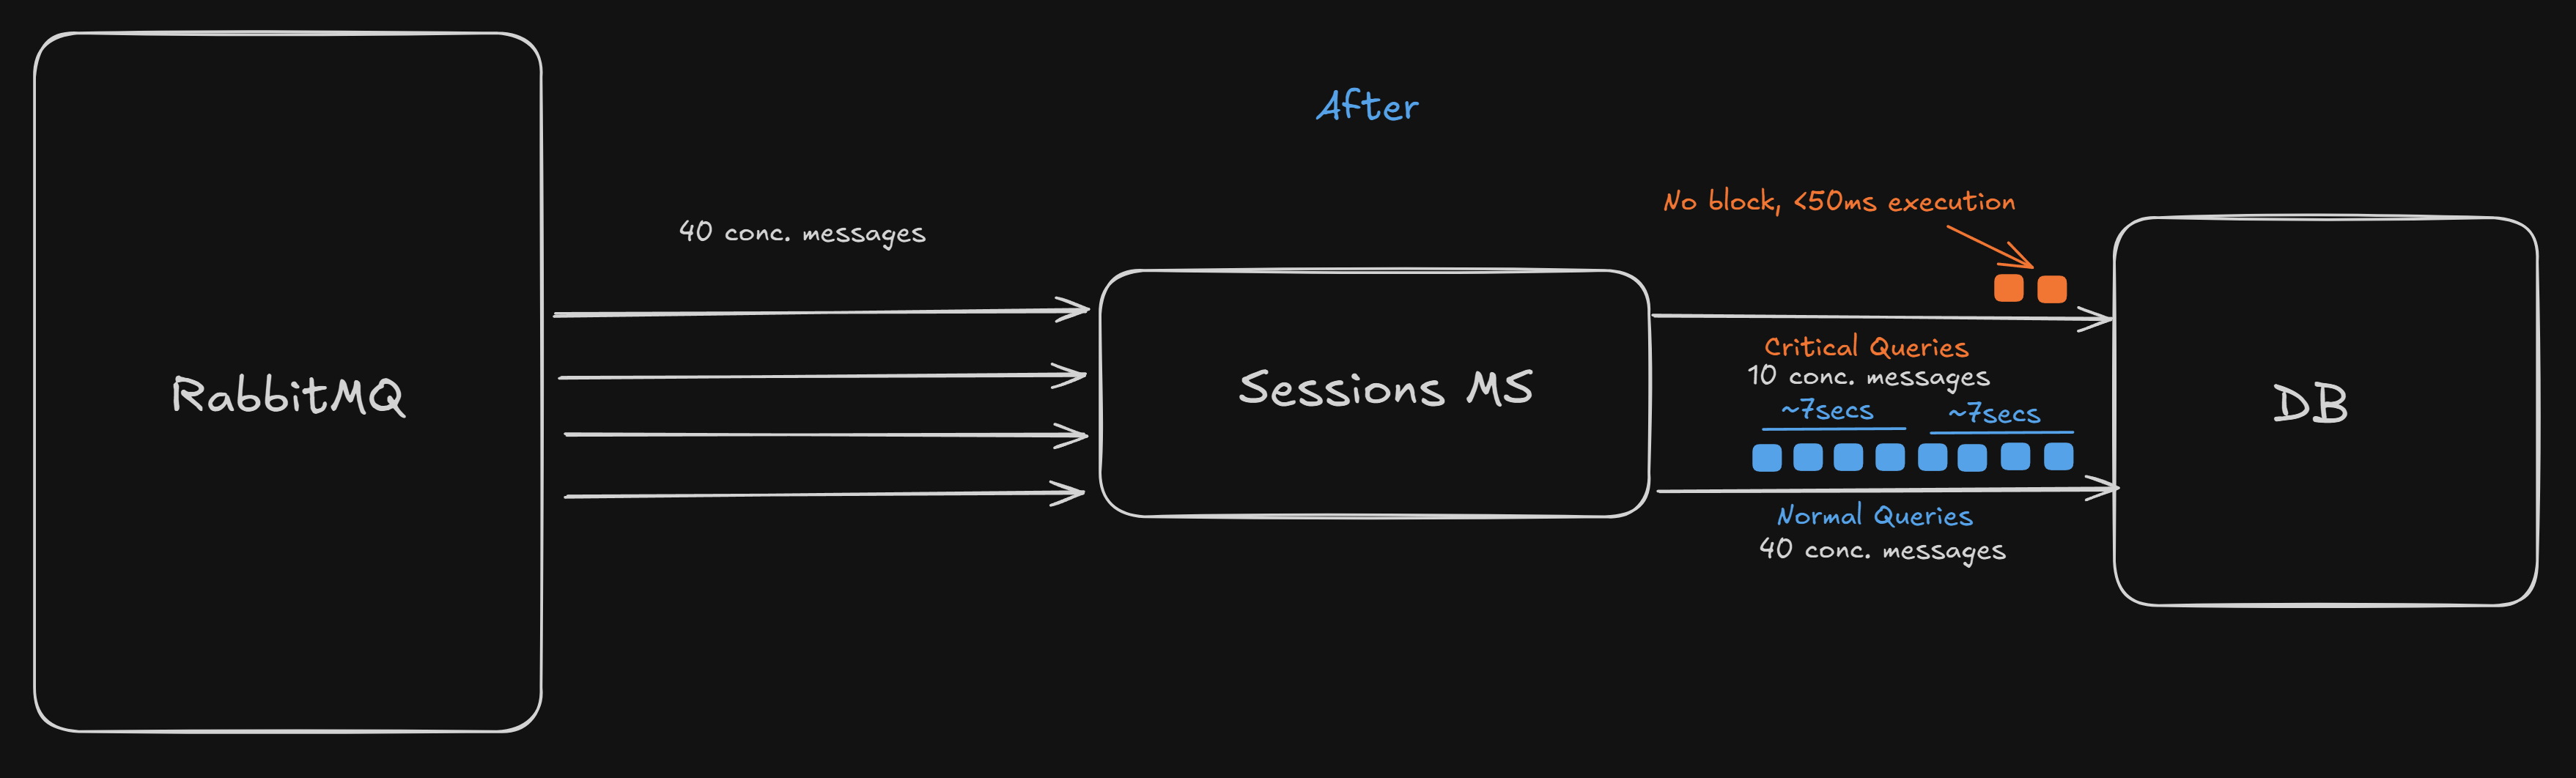
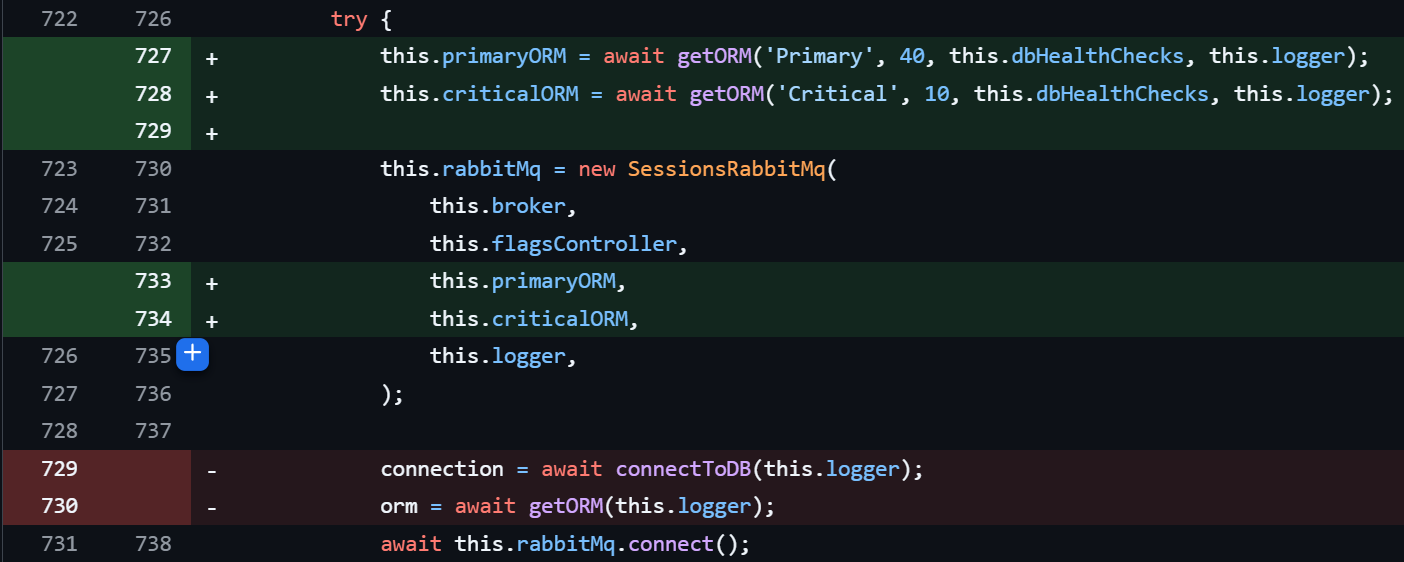
We shifted from having one global ORM to two specialized ORMs with separate connection pools.
Code Glimpse: Dual ORM Setup
Immediate Results
We instantly saw the critical query read time dropping from >5 seconds to <50ms!
Aggressive Performance Tuning
We didn't stop here, we aggressively tuned sessions-ms that day:
Made sure our ORM generated queries were using proper index, fixed 2 queries joining 20mil+ rows without an index, and instantly made overall queries 5x faster.
Added multi-column index on a hot path, where postgres refused to use the single-column indexes, again made 2x performance gain.
Moved most of the frequent update operations to Redis, drastically reducing DB locks.
Increased ORM pool size from 10 to 40 per pod: we arrived at this value by stress testing at what concurrency do we reach ~50% CPU limits.
Key Takeaways
Not All Queries Are Equal
Critical internal queries should never wait behind batch processing or analytics workloads. Segregate your connection pools based on query priority and latency requirements.
The Database Might Not Be the Bottleneck
Sometimes the issue isn't database performance but how your application accesses it. Connection pool exhaustion can make a healthy database appear overloaded.
Load Testing ≠ Production Reality
Our load tests didn't catch this because they focused on throughput, not the interaction between different query types competing for the same resources.
Monitor Pool Metrics
Connection pool wait times, active connections, and queue depth are critical metrics that should be monitored and alerted on.
One Year Later
It's been over a year now, and we've hardly ever faced sessions-ms performance degradation, even though our platform usage grew 100% almost every quarter. The incident that initially seemed like a disaster became a valuable learning experience that made our system more resilient.